Baseball Modeling
A dream of mine for a while has been to build a predictive model for baseball, specifically predicting the winner of the game. Ideally, it would be good enough to beat the sports betting market, but this is an enormous task.
Something unique about baseball is that it's not timed. Therefore, there are a countable number of unique gamestates. Each gamestate is unique up to the number of pitches in the game, plus any events that happen in between pitches. Each gamestate is one possible data point, with all of its corresponding features (current score, players, current inning, etc.).
Baseball Modeling MVP
I have completed an MVP to demonstrate the intended functionality. The program uses the MLB-provided mlb-stats-api to create an original starter dataset and pull data from games in real time. Below is the command-line interface for the MVP.
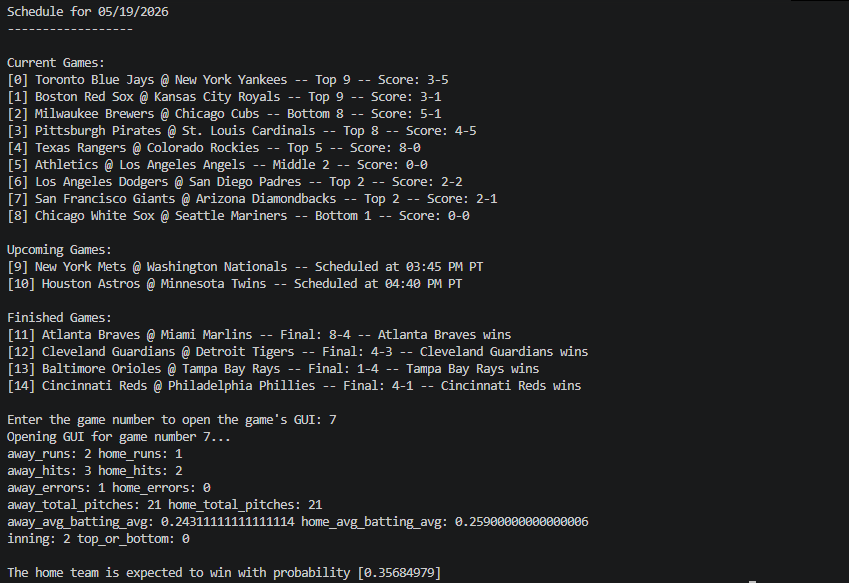
When the user runs the program, it prints all the day’s current and scheduled games, and the user can select any of them to make a prediction. In this screenshot, the user selected 7 for the current San Francisco Giants @ Arizona Diamondbacks game, and the model predicts that the home team will win with a probability of [0.3568]. The program also prints some stats for reference, which you see above the prediction.
Here’s how that game actually ended.
Current State of the Project
Currently, I am focused on building the data universe. Ideally, I would have every gamestate from every game ever played organized and at my fingertips. Sports data is very well kept, but unfortunately the overlords make it difficult for the public to download. I have considered various ways of gathering the data, but for now, I am trying to use a community-run data site, Retrosheet, to organize historical data. The data is kept in custom event files, and they need to be parsed to organize the data into usable Python dictionaries, for example.
This is the current task -- parsing the Retrosheet event files.
The data will be organized into Python "dict of dicts", 3 in total, one for each of batters, pitchers, and teams. Below is an outline of the batter dict of dicts, for example:
- Batter dict of dicts:
- Bryce Harper
- At bats
- Home runs
- Walks
- Strikeouts
- …
- Ketel Marte
- At bats
- Home runs
- Walks
- Strikeouts
- …
- …
- Bryce Harper
Note that all of these will be cumulative, meaning the "walks" entry in a batter's dict will be their total career walks up until that point. We will store the cumulative dict of dicts after every game parsed, and to get useful input variable values, we will difference the cumulative dict of dicts from two different dates to get the statistics in that time span. For example, if we think that "strikeout percentage in the last 10 games" will be a useful feature, we would calculate that using today's cumulative dict of dicts and the cumulative dict of dicts from 10 games ago. Also, it only makes sense to use raw statistics in this cumulative fashion to be used for differencing. Then, we can compute common secondary statistics such as strikeout percentage, batting average, on base percentage, etc.
Roadmap and Ideas
Here is a rough roadmap of the project:
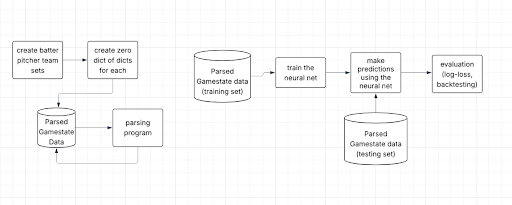
The left flow chart is creating the training data, and the right flow chart is what we'll do with it. Given that we will have an enormous amount of data (approx. 150 pitches / team / game * 162 games / year * 30 teams * 100+ years = tens of millions of data points), a neural net will likely be our best bet.
We will use log-loss to determine model quality, and we will see how our predictions perform against the sportsbetting market. It is difficult but possible to get historical sportsbetting odds, which makes backtesting possible. Again, the lucrative outcome would be to build a model that reliably beats the sportsbetting market.
As far as future ideas, I have pondered other unconventional data types besides measurable statistics. One such data type that I actually tested is emotion data. I like to pay attention to the human element of the game. How are players reacting to key events? How is the pitcher keeping his composure? Are the batters visibly frustrated by the pitches they're receiving? I imagine this "emotional element" can be a good predictor for the outcome of the game, so I sought to test the hypothesis.
I collected a few photos showing clear shots of the players from each of the Diamondbacks' first 20 games in the 2025 season and used Deepface, an open-source AI algorithm, to classify each of the images into an emotion score. Then, I plotted the correlation between each of the emotions and win/loss outcome:
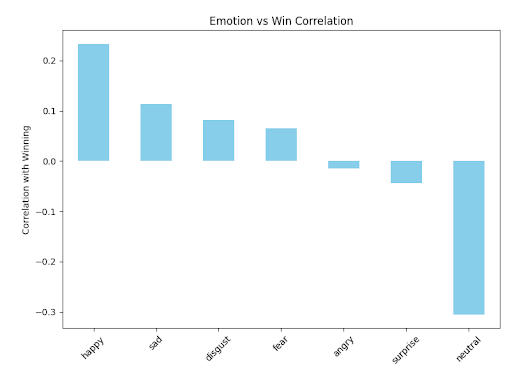
The results are what I personally would expect: happy emotion is most strongly correlated with the team winning, and neutral is most negatively correlated with the team winning. However, this is on a small sample size using published photos, which makes me think there could be selection bias at play. More robust analysis is needed.
Other ideas for unconventional data types would include community opinion, such as gathering natural language from social media sites or from announcers on the broadcasts themselves. This could also help capture the "vibe" of the game which doesn't show up well in raw numerical data.
MVP Code and Presentation Slides
I gave a guest presentation on this project for the USC class MATH 446: Data Science with Python in the Spring 2025 semester. You can find the slides for that presentation, along with the code for the MVP, here.